Measuring Progress, Leading the Way, and Building a Sustainable Future: Fish City’s 2026 Carbon Footprint Report
At Fish City, sustainability is the foundation of everything we do. From the seafood we source to the way we operate our restaurant, our goal has always been clear: to serve exceptional food whilst protecting the oceans, ecosystems, and communities that make it possible.
Over the years, we have taken meaningful steps to measure, understand, and reduce our environmental impact. Our newly completed 2026 Carbon Footprint Report represents an important milestone in that journey. For the first time, our internal team led the entire carbon footprint measurement process—from collecting operational data to analysing performance—giving us deeper insight into our environmental performance and strengthening our ability to drive meaningful change.
This report not only highlights where we are performing well but also identifies areas where we must continue to improve. Most importantly, it demonstrates our commitment to transparency, accountability, and continuous progress.
Our Sustainability Commitment
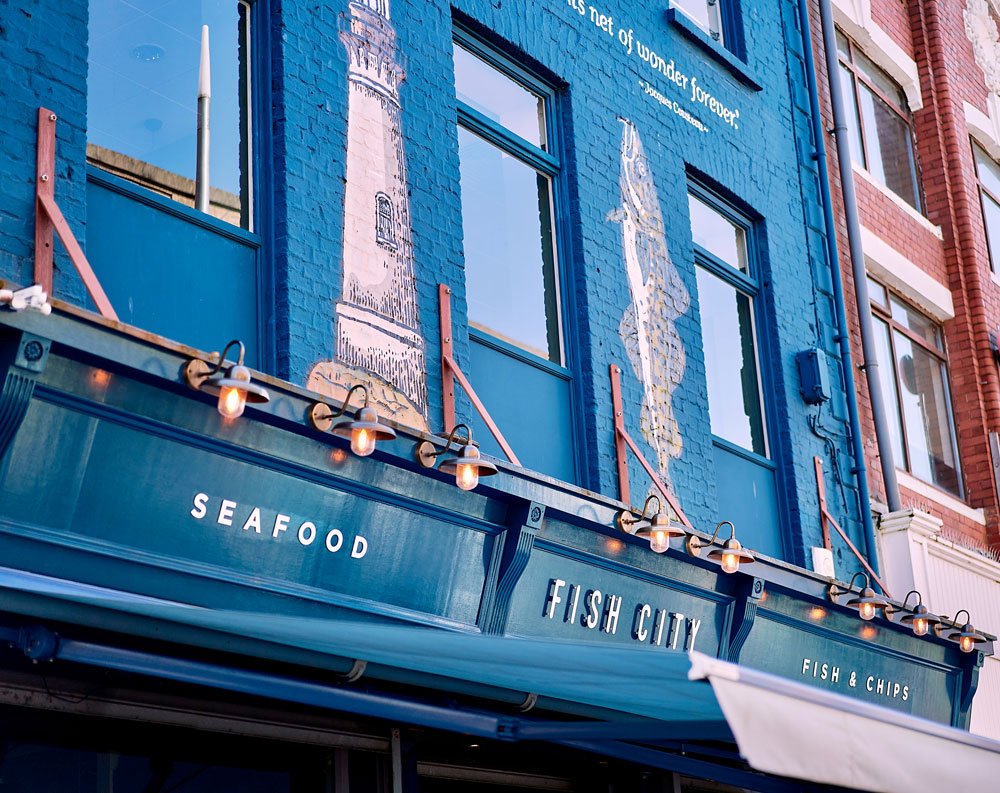
Fish City is proud to be recognised as one of the UK’s and Ireland’s leading sustainable seafood restaurants. Our work has been acknowledged through numerous certifications and awards that reflect our long-standing commitment to responsible business practices.
We are proud to be certified by the Marine Stewardship Council (MSC) for our commitment to sustainable seafood, a Gold Award holder with Green Tourism, named Northern Ireland’s Sustainability Champion at the Hummingbird Awards 2025, winner of the Environment & Sustainability Award at the National Fish and Chip Awards 2023, and recipient of Good Food Ireland®’s Tourism Sustainability Award and Supreme Award of the Year 2025. These accolades reflect the principles that guide our work: promoting locally, sustainably, and ethically produced food; protecting biodiversity; building sustainability knowledge and awareness within our team and amongst our guests; and engaging passionately with our communities. But awards alone are not the measure of success. What matters most is our ability to measure our impact and continuously improve.
Our Carbon Measurement Journey
Our carbon footprint reporting did not begin in 2026. Over the past several years, we have worked with sustainability consultancies to understand the environmental impact of our operations.
Establishing Our First Baseline (2020)
Working with Tony Traill of Element Consultants, we established 2020 as our first baseline year. This report measured a wide range of operational impacts, including: water consumption, energy use, effluent and sewage, waste, production and output, products and services, packaging materials, and transport. From this data we calculated our carbon intensity to be 0.0001 TCO₂e per £ of revenue with total carbon emissions of 46.38 TCO₂e.
The analysis identified production/output and products/services as our largest sources of emissions. Based on these findings, two priority actions were identified:
The creation and implementation of a Biodiversity Action Plan
Conducting water efficiency and energy efficiency surveys to guide reductions in resource consumption
This early work laid the foundation for our ongoing sustainability strategy. (And we actioned our Biodiversity Plan later on in early 2024.)
Updating Our Baseline with Climate Essentials (2023)
In 2024 we worked with sustainability consultancy Climate Essentials as part of Belfast City Council’s Belfast Business Promise initiative. This project allowed us to analyse our environmental impact using 2023 as a new reporting baseline. The report covered a comprehensive set of environmental indicators including: carbon footprint analysis, energy consumption, water usage, waste management, pollution and emissions tracking, and sustainable sourcing.
Our total carbon emissions for the 2023 reporting period were measured at 77.7 tonnes of carbon dioxide equivalent (tCO₂e).
Key findings included:
Scope 1 emissions: 0%
Scope 2 emissions: 39.5% (33.3 tCO₂e from 148,135 kWh of electricity)
Scope 3 emissions: 60.5% (including energy-related activities and operational waste such as water, food waste, recyclables, and general waste)
Scope 2 emissions were calculated using the location-based approach, which measures emissions based on the average carbon intensity of the national electricity grid.
This report gave us a clearer picture of the indirect emissions associated with our operations and highlighted the importance of improving energy efficiency and waste management.
A New Milestone: Our First In-House Carbon Footprint Report
In January 2026 we joined Tourism Northern Ireland’s Carbon Calculator Pilot Initiative, which supports tourism businesses in measuring and benchmarking their carbon footprint using the globally recognised EarthCheck carbon calculator. EarthCheck is the world’s leading certification, consulting and advisory group for sustainable destinations and tourism organisations. This programme represented a major step forward for our team. We were mentored by Danielle McCormick, Chief Executive of Triterra and founder of the All-Ireland Sustainability Summit, who coached our team through the entire process—from data collection to analysis.
For the first time, our in-house team gathered and analysed all operational data, we used EarthCheck’s benchmarking tools directly, and we built our own internal dataset for future reporting.
Previously, we submitted operational data to consultants who completed the analysis externally. Whilst those partnerships were invaluable, conducting the process internally has dramatically increased our understanding of our environmental performance.
This experience has empowered our team with the knowledge and tools to continue measuring and improving our carbon footprint year after year.
Looking ahead, we also plan to expand our dataset both forward and backward in time—using historical operational records to establish earlier benchmark years and building consistent annual reporting moving forward.
Key Findings from the 2026 EarthCheck Performance Report
The EarthCheck report establishes 2025 as our new benchmarking year, allowing us to compare our performance with regional tourism and hospitality businesses. The results demonstrate that Fish City is performing strongly in several key environmental indicators.
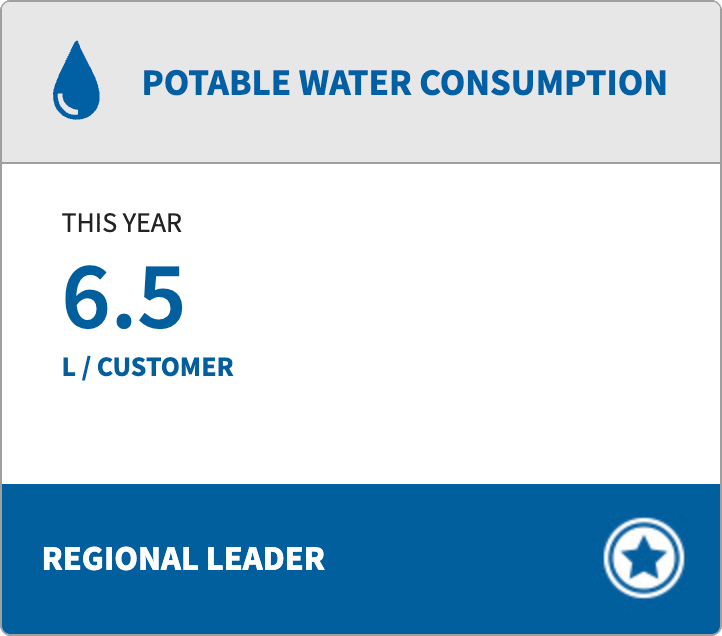
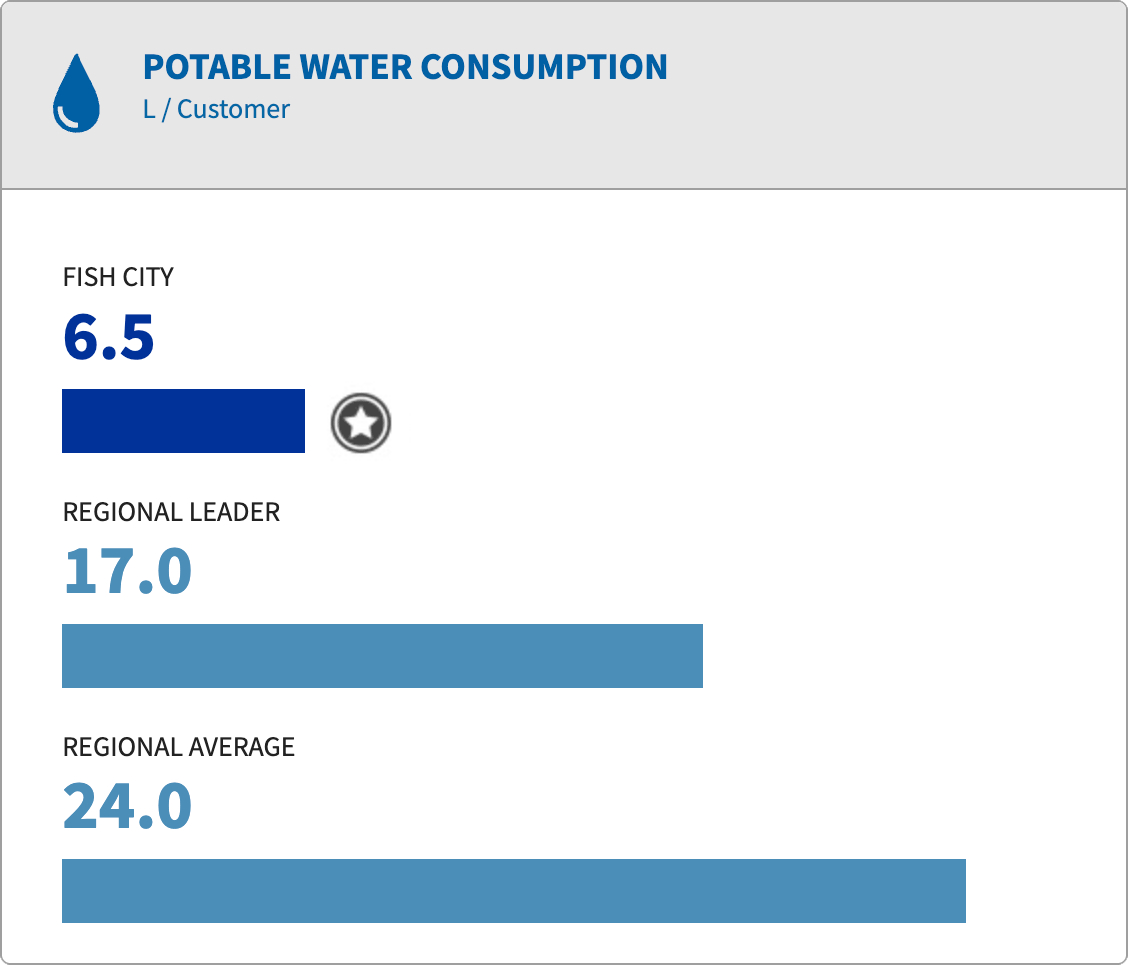
Regional Leadership in Water Efficiency
One of our most significant achievements is our low potable water consumption.
Fish City: 6.5 litres per customer
Regional leader (next best): 17 litres per customer
Regional average: 24 litres per customer
This means our water use per customer is significantly lower than both the regional average and our closest competitor. In total during 2025, our water consumption was measured at 340,000 litres.
Efficient water management is critical not only for reducing environmental impact but also for protecting local ecosystems and marine environments.
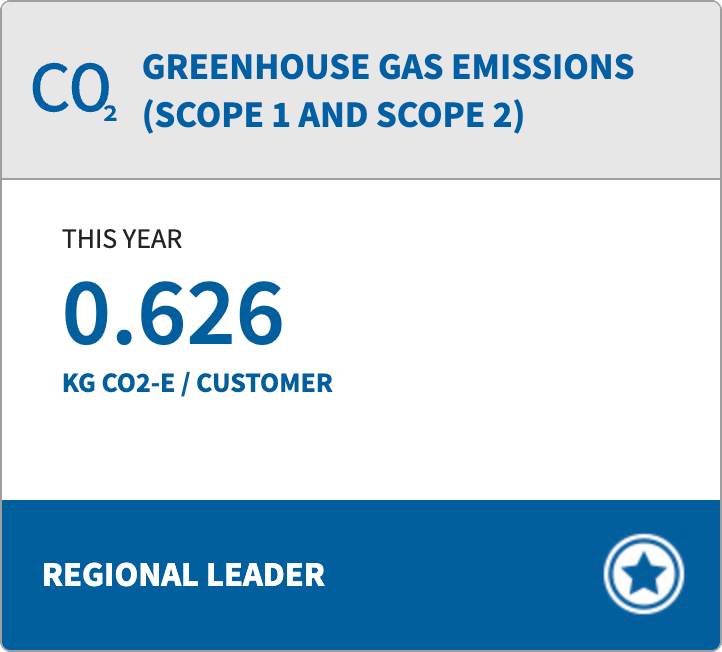
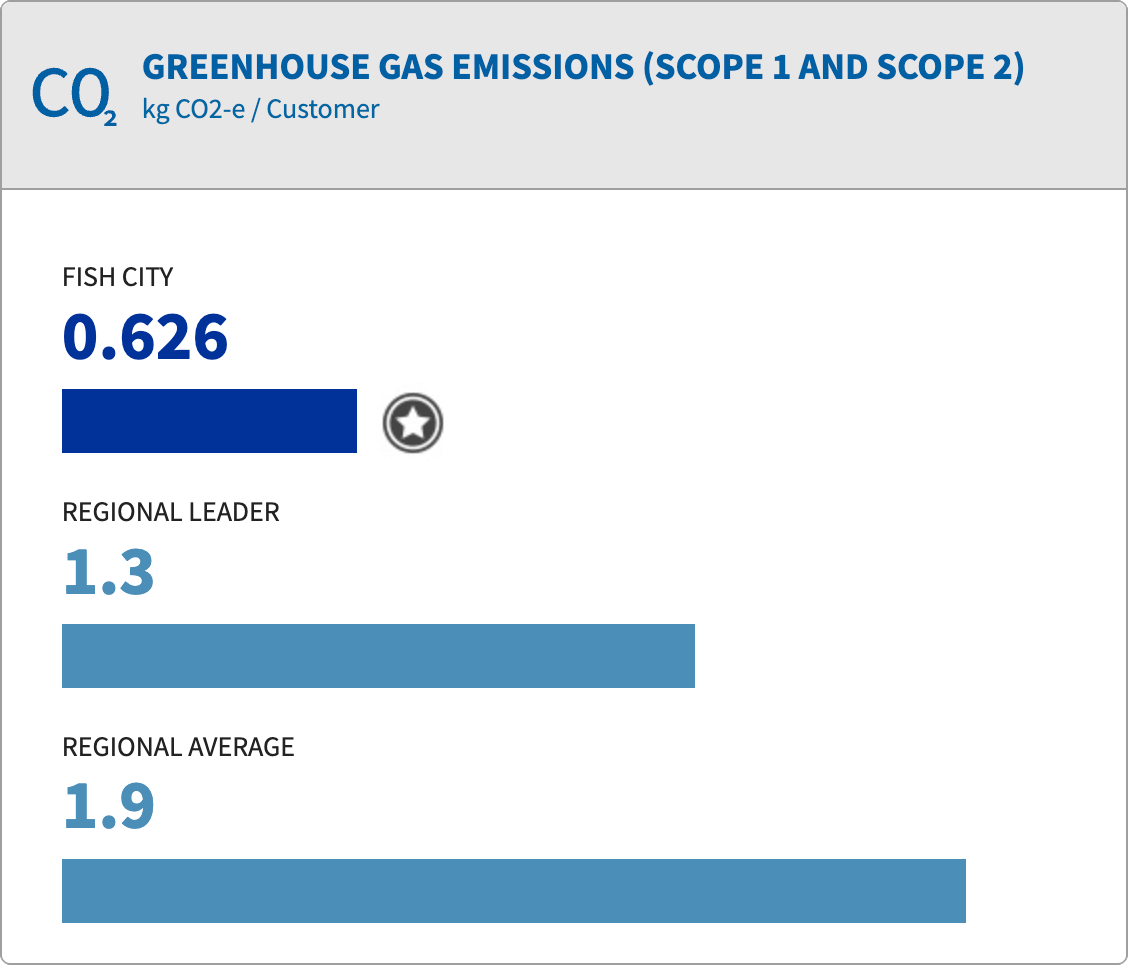
Outstanding Performance in Greenhouse Gas Emissions
Fish City also ranks as a regional leader in greenhouse gas emissions for Scope 1 and Scope 2.
Fish City: 0.626 kg CO₂e per customer
Next regional leader: 1.3 kg CO₂e per customer
Regional average: 1.9 kg CO₂e per customer
This places Fish City ahead of the benchmark for hospitality businesses in the region.
In total during 2025, our total emissions (Scope 1 & 2) were 33,002 kg CO₂e. This strong performance reflects the sustainability practices already embedded in our operations—from responsible sourcing to energy awareness across our team.
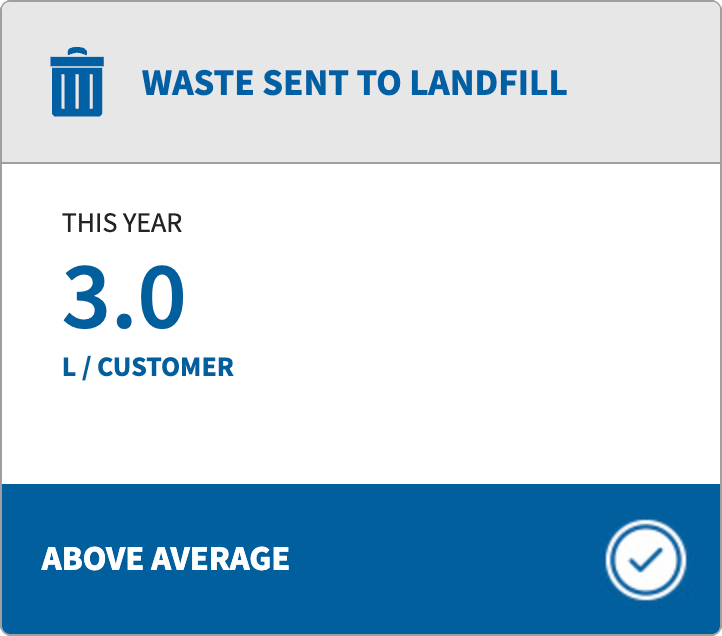
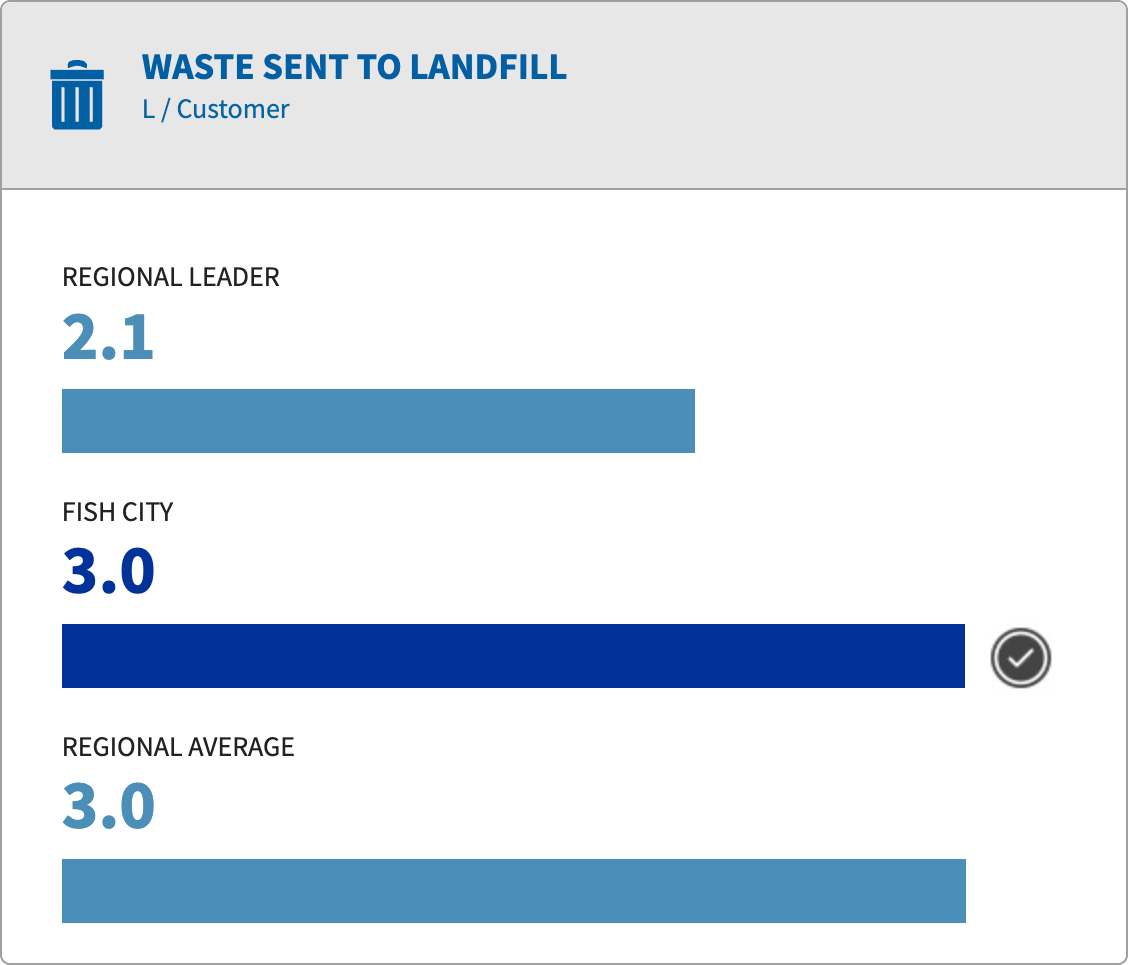
Waste Management: Above Regional Average
Waste reduction is another important part of our environmental strategy.
For waste sent to landfill:
Fish City: 3.0 litres per customer
Regional leader: 2.1 litres per customer
Regional average: 3.0 litres per customer
While we match the regional average and perform better than many businesses, we recognise there is still room to improve in this area. In 2025, our total waste sent to landfill was 157,904 litres.
Reducing landfill waste remains an important focus as we continue expanding recycling, composting, and waste reduction initiatives.
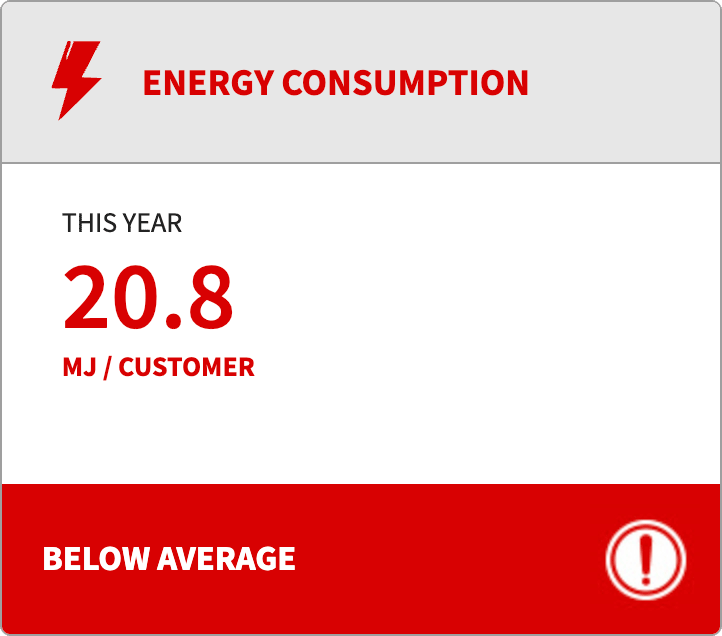
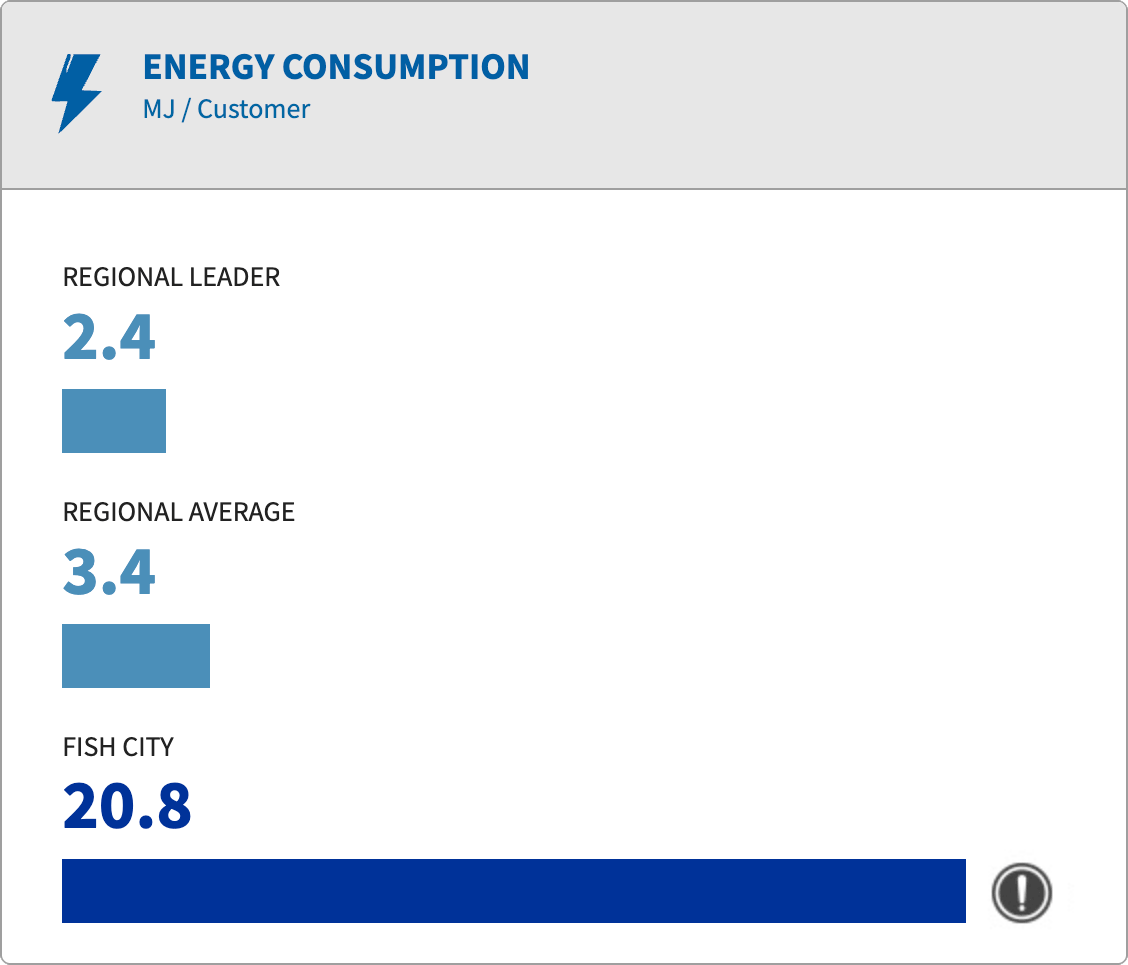
Energy Consumption: Our Main Area for Improvement
Whilst our performance in several areas is strong, the report highlights energy consumption as our primary challenge.
Our results show:
Fish City: 20.8 MJ per customer
Regional average: 3.4 MJ per customer
Regional leader: 2.4 MJ per customer
This indicates that improving energy efficiency must be a key priority moving forward. In total during 2025, our energy use totalled 1,096,265 MJ.
Energy consumption represents our greatest opportunity to reduce both environmental impact and operating costs.
Recommended Actions for Energy Reduction
The EarthCheck report provides several recommendations to help improve our energy performance in the coming years. These include: transitioning to low-emission energy sources, implementing structured energy efficiency programmes (e.g. reviewing equipment efficiency, and improving operational energy management), and increasing renewable energy use (e.g. exploring solar, wind, or hydroelectric energy options), and investigating sustainable energy supply solutions (e.g. working with suppliers to access greener energy options). Based on report findings, we are encouraged to consultation of best-practice guidance on: efficient air conditioning, efficient lighting, public area lighting improvements, efficient water heating, and HVAC retrofitting. These recommendations provide a roadmap for improving our environmental performance in future reports.
Why This Report Matters
Beyond the numbers, the most significant outcome of this year’s carbon footprint report is the knowledge and capability built within our team.
By completing the process internally, we have developed a deeper understanding of how our operations affect the environment, created a reliable system for tracking sustainability performance, and built the foundation for continuous improvement. Most importantly, we now have the tools to measure our progress consistently over time.
Sustainability is not achieved through one report or one initiative—it requires long-term commitment, transparency, and collaboration.
Looking Ahead
The 2026 report marks the beginning of a new chapter for Fish City’s sustainability journey.
Our next steps include:
Expanding our dataset using historical records to create earlier benchmarking years
Continuing annual carbon measurement using the EarthCheck calculator
Implementing energy efficiency improvements across our operations
Further reducing waste and resource consumption
Strengthening biodiversity and sustainable sourcing initiatives
As a restaurant built on sustainable seafood, we believe our responsibility extends beyond the plate. By understanding and reducing our environmental impact, we can help protect the oceans, ecosystems, and communities that sustain us.
A Collective Effort
None of this progress would be possible without the dedication of our team, our partners, and our customers who support sustainable dining. Every meal served at Fish City is part of a wider story—one that connects responsible fishing, local producers, environmental stewardship, and community engagement. Our 2026 Carbon Footprint Report shows that while there is always more work to do, we are moving in the right direction. And we are just getting started.